What is poverty?
Through Enough for All, poverty is defined as the condition in which people lack the supports, means, and choices needed to attain and maintain a basic standard of living. In short, poverty is always about income, but not only about income. While the concept of poverty may seem straightforward, identifying who is experiencing poverty can be complicated. Researchers use different methods to determine who is living in poverty, and each approach focuses on different aspects of financial hardship. As a result, the way poverty is measured can change how many people are identified as living in poverty. [1,2]
Beyond simply identifying whether someone is living in poverty, there is also the concept of depth of poverty. Referring to the fact that not everyone experiencing poverty faces the same level of hardship. For instance, someone earning one-tenth of the median income is likely experiencing far greater financial need than someone earning half the median income, even though both may be considered to be living in poverty. As a result, poverty measures may be adapted to assess the severity of poverty someone is facing. For example, the term “deep poverty” is sometimes used to refer to someone with less than 75% of the Market Basket Measure (MBM).[3] The MBM is Canada’s official poverty measure and is explained in more detail below.[4] In this blog, we explore common measures of poverty and low income, describe how poverty is measured in the Well-Being Dashboard, and explain why VCC uses this approach.
The measures of poverty
Market Basket Measure (MBM)
The MBM defines poverty based on a household’s ability to afford a modest standard of living. If a household cannot afford a modest standard of living, it is said to be experiencing poverty.[5]
The goods and services associated with a modest standard of living are called the basket. These include things like food, clothing, housing, utilities, transportation, etc. The items included in the basket are updated periodically to ensure they continue to reflect a modest standard of living. For instance, in 1995, a cell phone was a luxury item, but in 2026, it is a necessity. The year in which the MBM is updated is referred to as the base year, which now occurs every five years.[6] To determine if someone is living in poverty, the MBM uses disposable income, not gross income. Disposable income is the amount of money a person has available after taxes and certain unavoidable expenses have been deducted. [7]
In 2024, the most recent year for which data is available, Statistics Canada reported that in Calgary, 11.1% of people were living in poverty based on the MBM.[8]
Low-Income Cut-off (LICO)
The LICO measures poverty by looking at how much of a household’s income is needed to cover basic needs, like food and shelter. Specifically, a household is considered to be living in poverty if it is expected to spend at least 20% more of its income on necessities than the average household, taking into account the size of the household and the community where it lives.[9] The idea behind the LICO is that households with lower incomes have to spend a much larger share of their income on basic needs, leaving less money for everything else.
Statistics Canada provides the LICO using both before- and after-tax income, each offering different insights.[10] For instance, the after-tax measure shows the extent to which taxes impact poverty. The before-tax measure shows how well employment, transfers, and other income sources provide income. After-tax measures are particularly useful when measuring poverty, as they reflect the available income a household has access to.
In 2024, the most recent year for which data is available, Statistics Canada reported that 7.7% of Calgarians were experiencing poverty based on the after-tax LICO.[11]
Low-Income Measure (LIM)
The LIM defines poverty as having an income that is less than half the median income, adjusted for the size of a household.[12] Statistics Canada does not adjust the LIM for regional cost-of-living differences. This makes it useful to compare low-income rates across groups and time, but it doesn’t necessarily reflect the depth of poverty, as the cost of living can vary substantially across the country.
Statistics Canada provides the LIM for market income, after-tax income, and total income, with each offering different insights.[13] For instance, market income reflects the adequacy of privately generated income; the after-tax measure shows the impact of taxes on poverty; and total income indicates adequacy of income when considering all available income sources. The City of Calgary uses a version of the after-tax LIM to understand how many Calgarians are living in low-income and to plan for additional municipal services.
In 2024, the most recent year for which data is available, Statistics Canada reported that 10.8% of individuals in Calgary were experiencing poverty based on the after-tax LIM.[14]
Homelessness-Income Cut-off (HICO)
Though not a measure of poverty, the HICO is a measure of the income a person or family needs to avoid homelessness after cutting back on other expenses.[15] People living under the HICO are assumed to have taken extraordinary steps to minimize their out-of-pocket expenses to keep their housing. These steps include moving to less suitable housing and relying heavily on food banks and other charities for their basic needs. Households with incomes below the HICO are considered to be at serious risk of homelessness.
The HICO is calculated by starting with the MBM and subtracting the savings that could be obtained by reducing expenditure on rent, groceries, clothing, transportation, and other expenses.[16] As such, it is more likely to reflect deep poverty (severe financial hardship) than poverty in general.
Based on a 2026 paper by the School of Public Policy at the University of Calgary, the HICO for a large Canadian city such as Calgary in 2023 was $17,438 for a single-person household.[17] This means that an individual with an income below this amount would be considered at serious risk of homelessness.
Material Deprivation Index (MDI)
The MDI looks beyond income to understand whether people can afford the goods, services, and activities most Canadians would consider part of an acceptable standard of living. Rather than focusing on a basket of goods or income like other poverty measures, the MDI asks people directly whether they can afford the things they need to live and participate in everyday life. This recognizes that while two people may have similar incomes, one may be able to meet their basic needs while the other cannot because of differences in costs, debt, savings, or other financial pressures. It provides insights into the real-life impacts of financial hardship that income-based measures may not fully capture.
The MDI starts by identifying goods, services, and activities that most people would expect to have access to, such as appropriate clothing for a job interview or an annual dental checkup. It then measures how many of these items people do not have because they cannot afford them. When someone reports being unable to afford multiple items or activities, they are considered to be experiencing material deprivation.[18]
Enough for All Well-Being Dashboard Approach
Vibrant Communities Calgary publishes the Enough for All Well-Being Dashboard, which tracks and visualizes more than 20 poverty and well-being-related indicators for Calgary.[19] The dashboard monitors Calgary’s progress in reducing poverty, broadly defined through a set of community well-being indicators, and can help identify emerging issues before they become crises. Given the dashboard's objectives, one of its central data elements is the percentage of people in Calgary living in income poverty.
The Well-Being Dashboard reports the MBM poverty rate over time, using the most recent available base year for each year. A benefit of the MBM is that Statistics Canada reports it annually and includes adjustments for geographic area and household size. As a result, specific values can be obtained for Calgary. The most recent base year is used in the Well-Being Dashboard because it is expected to provide the most accurate reflection of poverty, as the basket is tailored to the cost of a modest standard of living at that time. It’s important to note that different base years will yield different poverty rates. When Statistics Canada calculates poverty rates using the same income data but different base years, more recent base years tend to show higher poverty rates. Figure 1 shows the percentage of Calgarians living below the MBM for each year between 2015 and 2024 as shown in the Well-Being Dashboard. In 2024, 11.1% of Calgarians were experiencing poverty.
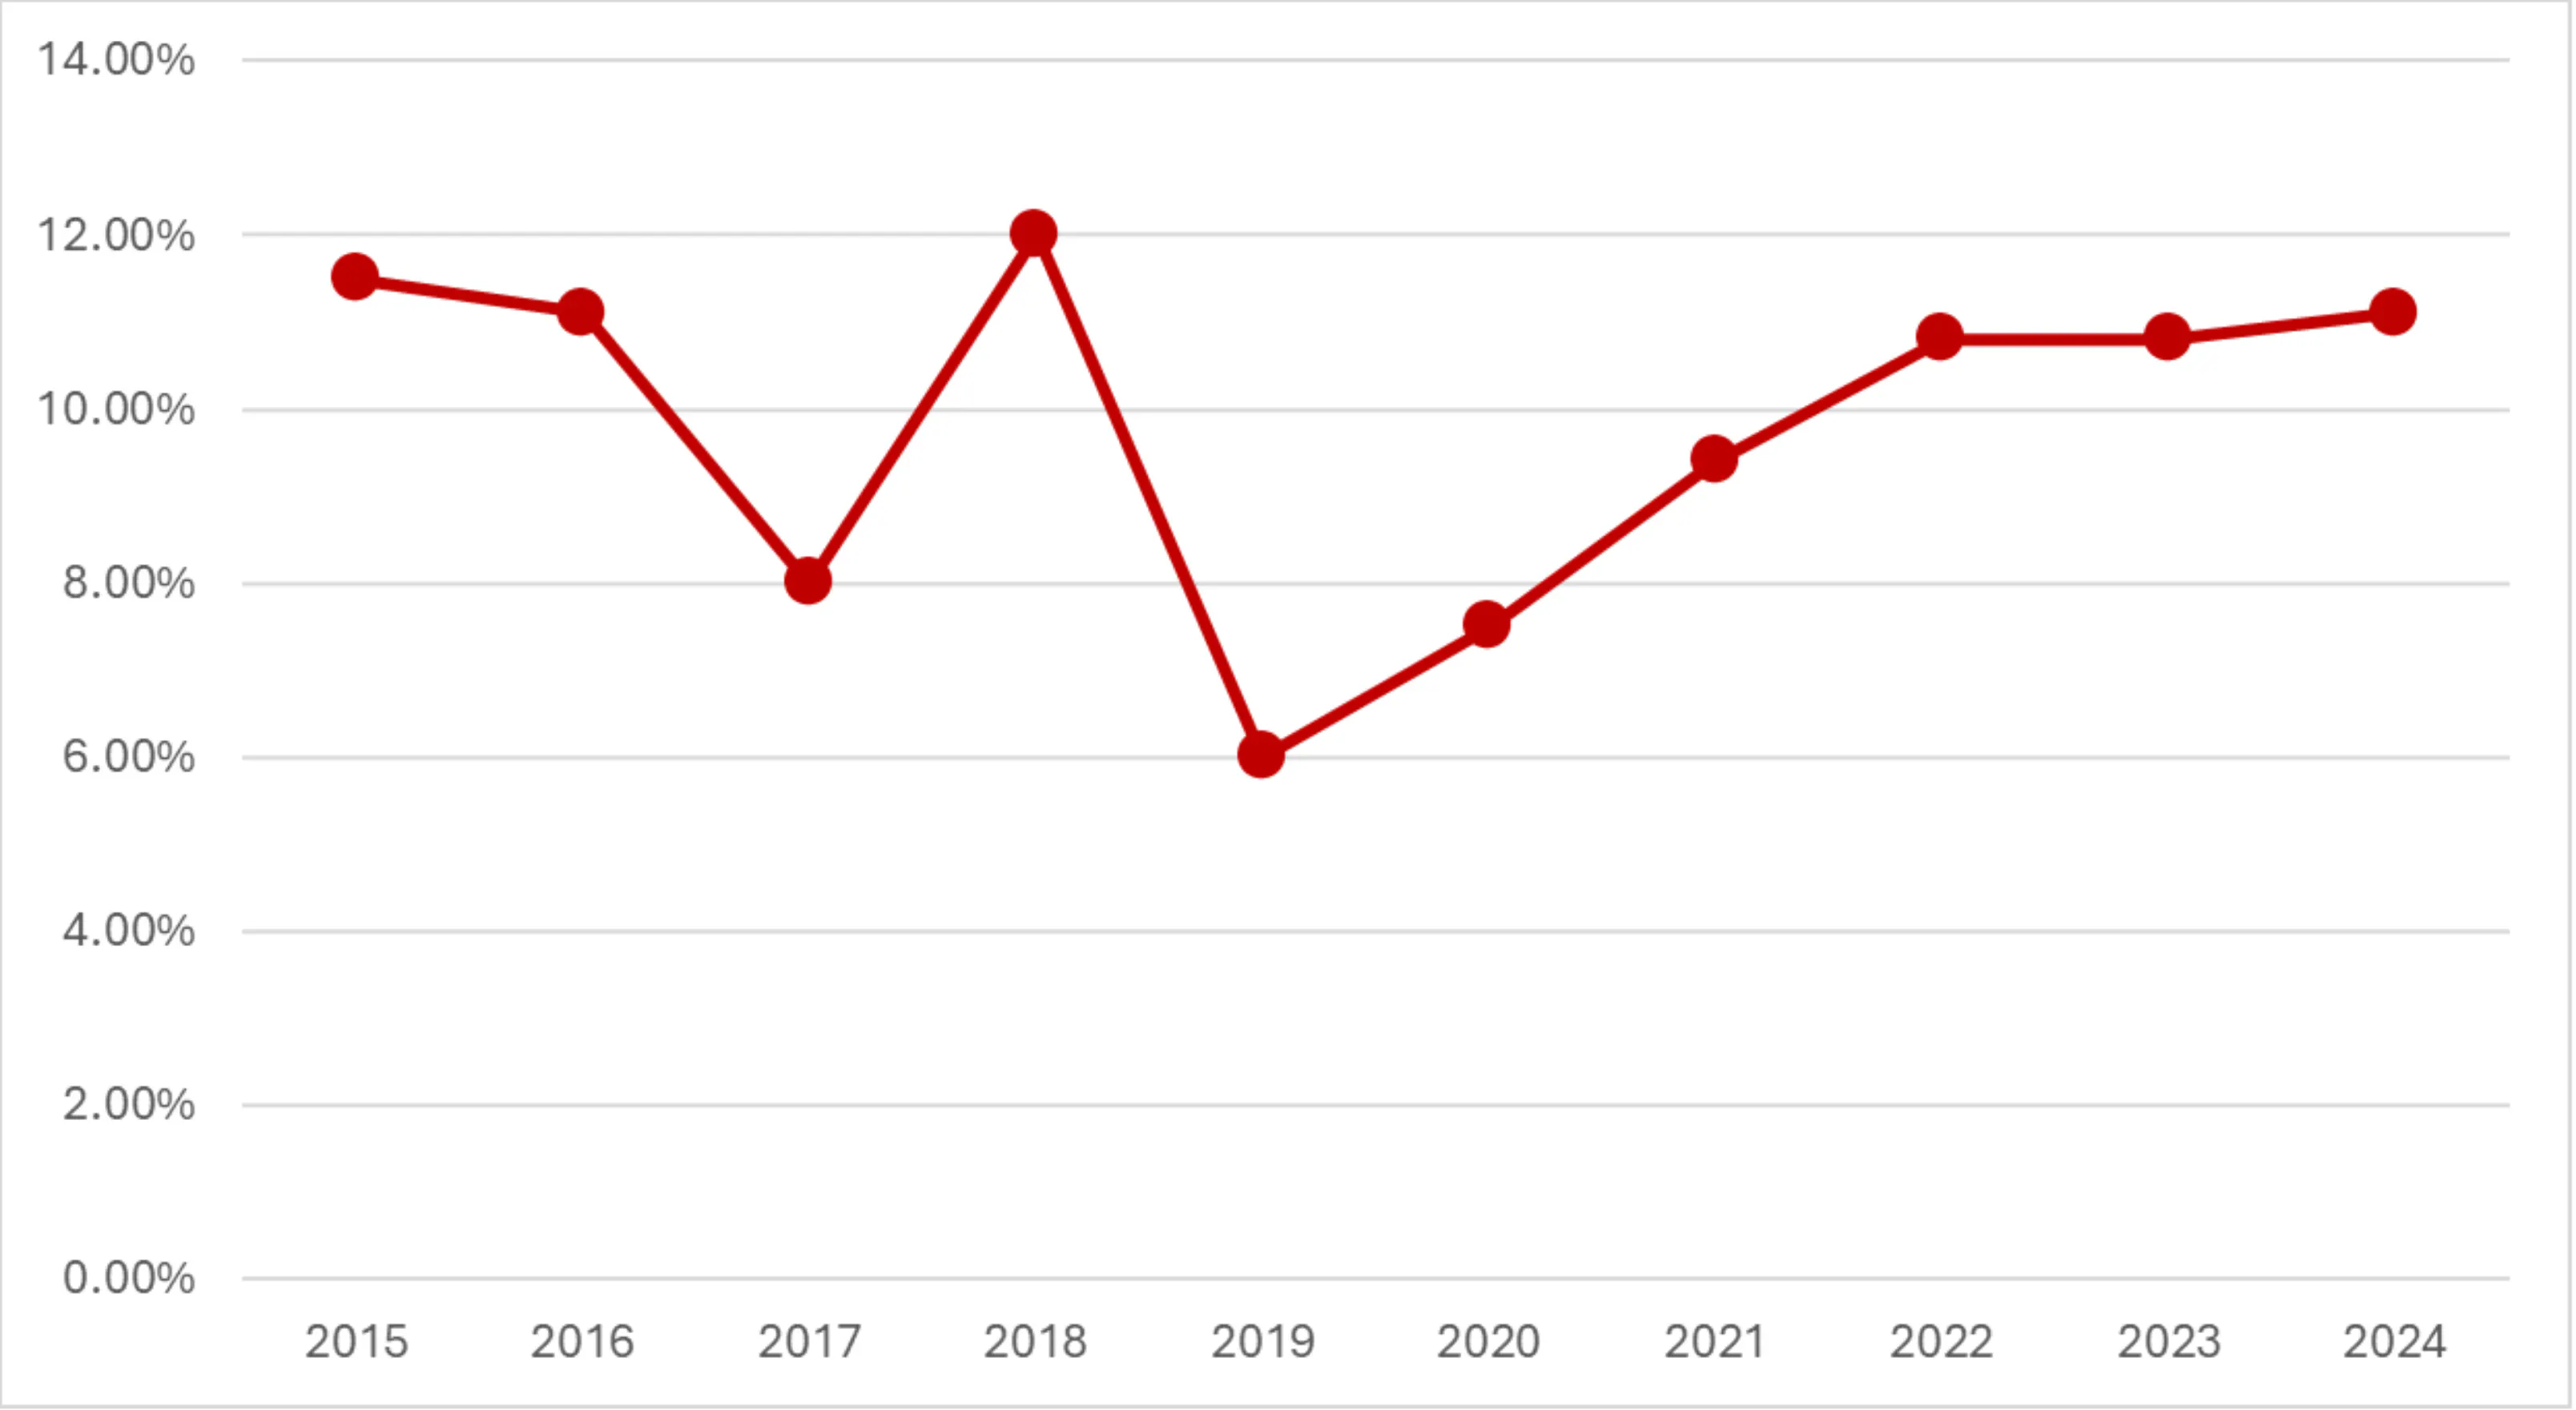
Figure 1. MBM Poverty Rate for Calgary Over Time as Shown in the Well-Being Dashboard. Source: Statistics Canada. Table 11-10-0135-01 Low-income statistics by age, gender and economic family type. DOI: https://doi.org/10.25318/1110013501-eng
Why measuring poverty matters
Understanding how poverty is measured is an important step toward addressing it. Different measures provide different insights into the experiences of people facing financial hardship, helping us identify where needs exist and what solutions are required. By building a clearer picture of poverty, we can better target supports, inform policy decisions, and work together to create a community where everyone has the resources and opportunities they need to thrive.